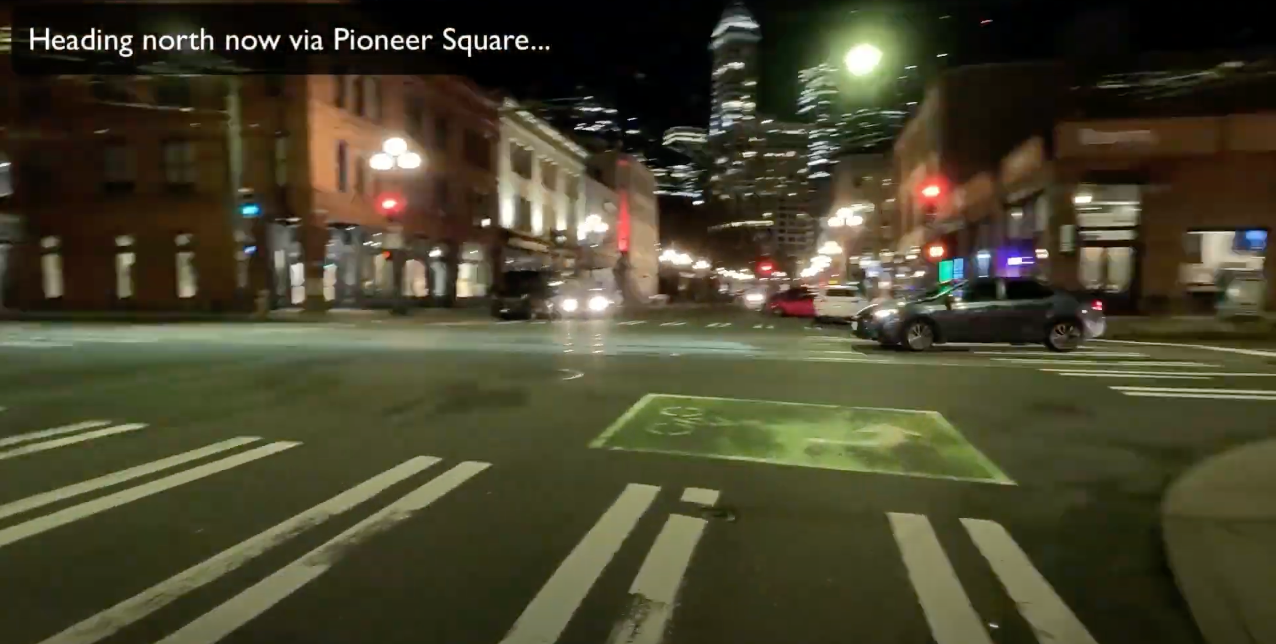
While in Pittsburgh I made good on a promise to myself. With my somewhat recent foray into collecting vinyl and building up a music collection, I deemed Pittsburgh would be my first in person record recon!
What’s a “record recon”? Well, borrowing a little shorthand military speak, recon is reconnaissance, which is a word that means:
- An inspection or exploration of an area, especially one made to gather military information.
- The act or operation of reconnoitering; preliminary examination or survey.
- An examination or survey of a region in reference to its general geological character.
That seemed like the perfect vibe for me in exploring new record stores. Since I was heading to Pittsburgh recently the decision seemed an obvious one to make. New territory to explore, new collections to add items to, Pittsburgh it would be!
With any reconnoitering of an area one has to do some research. What area would it be, how would the reconnoiter be done, what tactics and what strategy would be used? With all those questions, the first up was what areas would it cover.
Pittsburgh Record Stores
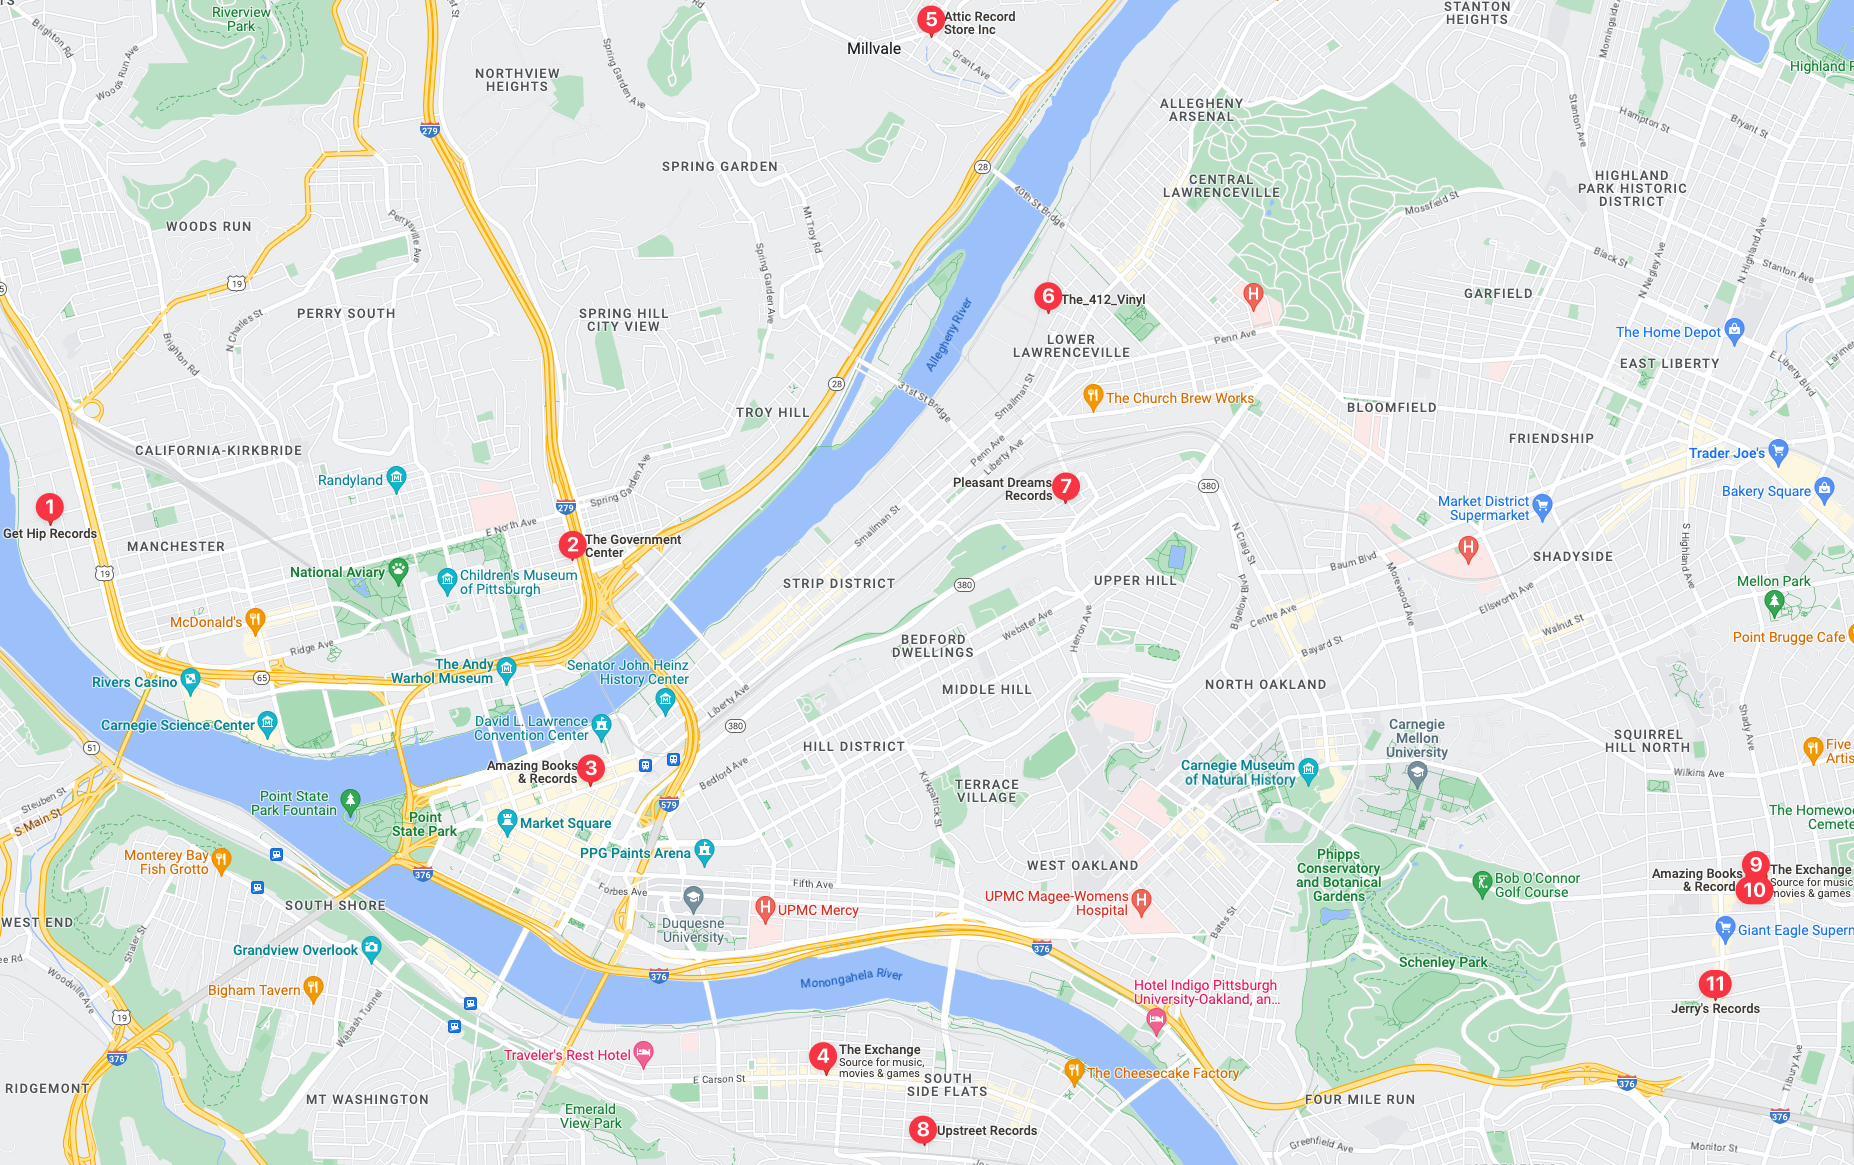
- Get Hip Records
- The Government Center
- Amazing Books & Records
- The Exchange (1 of several in the city)
- The Attic Store
- The_412_Vinyl
- Pleasant Dream Records
- Upstreet Records
- Amazing Books & Records
- The Exchange
- Jerry’s Records
My initial search gave me these results. With a little more research I took Upstreet Records off the list since I realized it’s a recording studio, not a record shop. The Amazing Books & Records and The Exchange stores seemed to be a chain – possibly local – but deprioritized just a little because of that. In addition The Amazing Books & Records didn’t seem focused enough that it would have a substantial collection, which push it down on the order of visit list that I’d be unlikely to get into one of the stores.
Another thing I did was read the reviews and try to figure out which ones would have a selection that would most likely lead me to picking up new albums. The two that seemed the most promising were The Attic Store, with second place coming in between Jerry’s Records and The Government Center.
With that, the ordered list of “must visit” to “if I can get there” came out like this.
- The Attic Store
- The Government Center (higher only because of proximity to where I was staying while in Pittsburgh)
- Jerry’s Records
- The Exchange (another proximity reason, one was in south end just down the street from my hotel.)
- Get Hip Records
- Pleasant Dream Records
- The_412_Vinyl
- The Exchange (the one further out by Jerry’s)
- Amazing Books & Records
Out of that I created the following missions based on where I intended to ride, various trails and routes existed, and where the stops would coincide with other things I wanted to do. As always, I aim for that insane level of efficiency per trip that is thought mythical in ole’ America!
☑︎ Mission 1: South Side Flats & Schenley Park Area Record Recon
- Jerry’s Records
- The Exchange (near Jerry’s)
- The Exchange (near Traveler’s Rest where I’m staying)
☑︎ Mission 2: Millvale & Government Center Record Recon
- The Attic Store
- The Government Center
☑︎ Mission 3: Chateu & Lower Lawrenceville Record Recon
- Get Hip Records
- The_412_Vinyl
So in the coming few weeks I’ll have mission recon reports along with the overall trip reports of the Pittsburgh trip. So stay tuned, and I’ll refer back to this post to see if I succeed on my record reconnaissance missions! Wish me luck! 🤘🏻